The dynamics of flow in confined geometries, such as in micro-fluidic and nano-fluidic devices, can be accurately described only if the physics of the flow at the interface between the fluid and the solid is thoroughly understood. The question of whether and how a Newtonian fluid is able to slip over a solid surface has arisen with the development of theoretical models for fluid motion at the beginning of the 19th century. Because of its high fundamental and technological importance, it has been continuously studied and controversially debated over the past two centuries, but a convincing conclusion is still lacking. To rationalize this controversy, new highly sensitive and accurate experimental approaches are needed. By using very small fluorescent tracers dispersed in the liquid and applying the sensitive technique of fluorescence correlation spectroscopy (FCS) we are able to obtain flow velocity profiles and quantify the slip for water flowing on both smooth hydrophobic and structured super hydrophobic surfaces.
Slip on smooth hydrophobic surfacesFollowing Navier, slippage is typically characterized by the slip length b, relating velocity u, and stress at the surface via the boundary condition u=b(∂u/∂n) with n being the normal to the surface. Most theoretical studies predict a slip length b < 100 nm for water flowing on smooth, hydrophobic surfaces. In order to address such small values we study the flow in the very close proximity of the solid surface using total internal reflection fluorescence cross-correlation spectroscopy (TIR-FCCS).
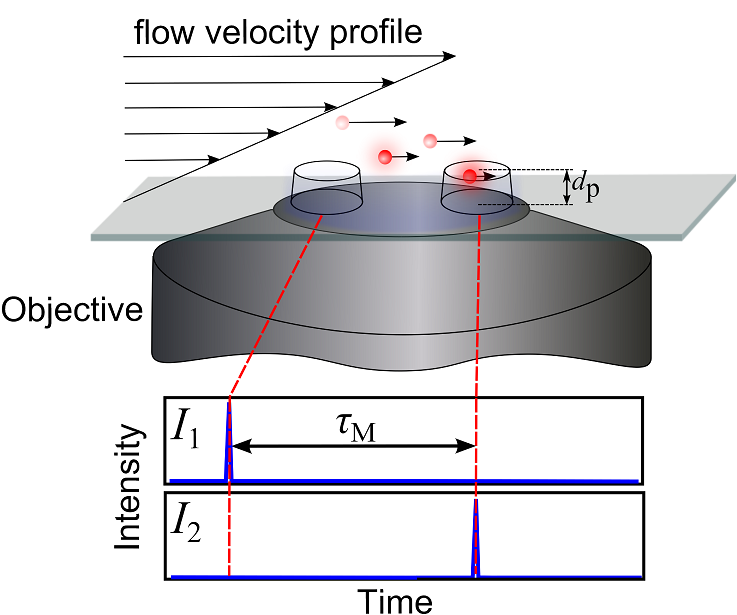
The TIR-FCCS principle: An evanescent wave that extends only ~ 100 nm from the glass wall of a micro-channel is used to excite fluorescent tracers (quantum dots) flowing with the liquid. The cross-correlation function of the fluorescence intensity signals (I1(t), I2(t)) from two small observation volumes that a laterally shifted in flow direction contains information on the tracer’s and hence flow velocity. 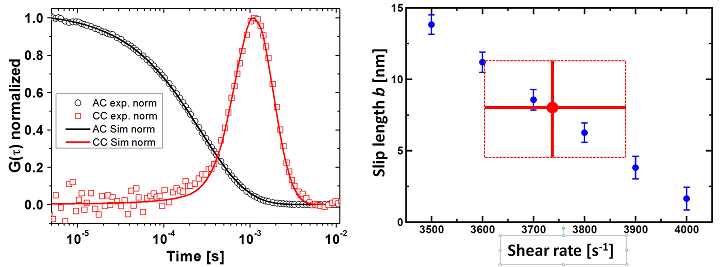 Left: typical
experimental correlation curves (symbols) and the corresponding fits (lines);
Right: the best fit parameters combination for shear rate and slip length. To
determine precisely the real slip length ≈ 8 nm, first the shear rate (3730 s-1)
was measured independently by using confocal FCS to map the flow profile across
the entire micro-channel. |
Slip on structured superhydrophobic surfacesWhile the intrinsic slip on smooth, hydrophobic surfaces is too small to affect most applications, presumably much larger and therefore technologically much more relevant effective slip is expected on rough surfaces.
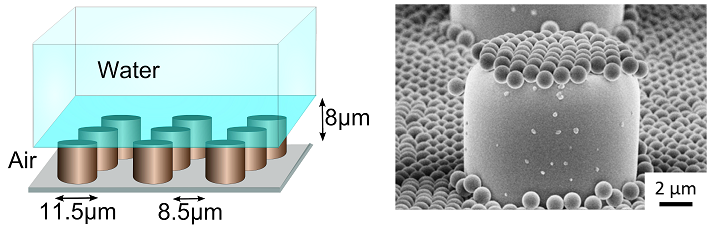
Left:
schematic representation of structured surface on which the water is in the
Cassie state. Right: scanning electron microscopy image of a pillar of our
model surfaces.
This type of slip is due to a fluid being in the
Cassie state; i.e., for typical superhydrophobic surfaces, air is entrapped
underneath the water in surface indentations. In this case, slip may be considered
on two length scales: (i) Effective slip that represents the inhomogeneous
surface by an averaging parameter and thereby characterizes the flow far from
the surface. Most experiments to date are limited to this global viewpoint,
e.g., by measuring a net drag reduction. (ii) Local, intrinsic slip, considered
at the length scale of the surface inhomogeneities. It is difficult to address
this local slip experimentally and thus it is typically treated in strongly
idealized way. We used confocal fluorescence correlation
spectroscopy, to perform detailed measurements of the local flow field and slip
length for water in the Cassie state on a microstructured superhydrophobic
surface. 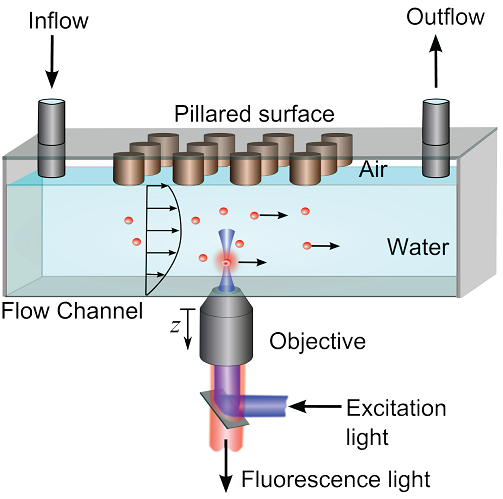 Schematic of the experimental setup for measuring local flow profiles 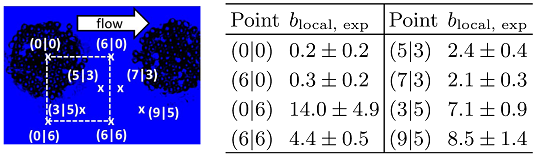 Left: Confocal microscopy image of the air-water interface (blue color corresponds to strong reflection signal) and the coated pillars (black). Measurement positions are indicated in a pillar referred coordinate system. Right: FCS-measured local slip length (μm). |
|
| ||