Intranet Search
You are here: Home Research Drug Nanocarriers

FCS Studies of Drug Nanocarriers


We use fluorescence correlation spectroscopy (FCS) to measure hydrodynamic radius, fluorescence brightness and local concentration of fluorescently labeled colloids and macromolecules (polymers, copolymers, proteins, DNAs) and thus investigate conformational changes, mutual interactions or aggregation. Among other applications, such FCS studies are especially useful to characterize drug nanocarriers (NCs) at all stages of the delivery process and allow monitoring of the carriers’ formation, drug loading efficiency, stability and kinetics of drug release.  To reach their target sites, NCs need to circulate in the bloodstream for prolonged periods without aggregation, degradation, or cargo loss. However, it is very difficult to identify and monitor small-sized NCs and their cargo in the dense and highly complex blood environment that is not transparent for visible light. To address this problem, we developed  two FCS aproaches that allow characterization of drug NCs in blood:  

Monitoring  drug NCs in a blood droplet


In the first approach we place a blood droplet of about 30 µL on a plasma separation membrane positioned directly above the FCS observation volume. The membrane  retains the large blood cells, but lets the liquid part of the blood and the NCs pass through, thus enabing their FCS characterization (Figure 1). We applied this approach to monitor changes in the size, concentration, and loading efficiency of pH-degradable fluorescent cargo-loaded squarogel NCs in the blood of live mice (Figure 2) for periods of up to 72 h after NCs injection.
 

Figure 1. Schematic representation of the FCS experiments in a blood droplet. (Left) Optical setup and sample chamber. (Middle) Schematic ilustrating how the membrane prevents the blood cells from reaching the detection volume. (Right) SEM images showing top view and  bottom view of the membrane. 


Figure 2. Monitoring the fate of drug NCs in blood stream of a mouse.
(Left) Normalized autocorrelation curves recorded in blood samples taken from a mouse 0 (green), 6 (blue), 24 (orange) and 72 h (magenta) after injection of NCs. (Right)  Hydrodynamic radius of the NCs  versus time after injection
. Data from 3 mice experiments are shown. In cooperation with L. Nuhn (MPIP, AK Weil) and L. Kaps (Mainz University Medical Center, TIM).  


Monitoring drug NCs in flowing blood


In the second approach we
monitor the NCs directly in whole blood, i.e. without removing the blood cells. To this end we use a fully near infrared FCS setup and perform experiments in slowly flowing blood to ensure time intervals, in which the FCS probing volume is free of blood cells, and thus accessible for the studied fluorescent species (Figure 3).  Using this approach, we reported the first FCS based measurements of the size, loading efficiency and stability of nanocarriers in whole blood [Figure 4].


Figure 3. Overview of the NIR-FCS experiments and data analysis in flowing blood. (Left) Blood containing fluorescently labeled polymer brushes (as a model for drug nanocarriers) is pumped through a flow channel. The FCS observation volume is consequently either free (schematics 1) or occupied (schematics 2) by a blood cell. Correspondingly, the fluorescence intensity time trace revealed high (1) and low (2) intensity time segments. (Right up) The experimental autocorrelation curve (squares) is fitted (line) with analytical model combining standard and inverse FCS, thus taking into account contributions of fluorescent species and blood cells, respectively. (Right down) The information extracted from the fit in panel (b) is used to subtract the cells’ contribution and obtain an autocorrelation curve (squares) resembling that of a standard FCS experiment.

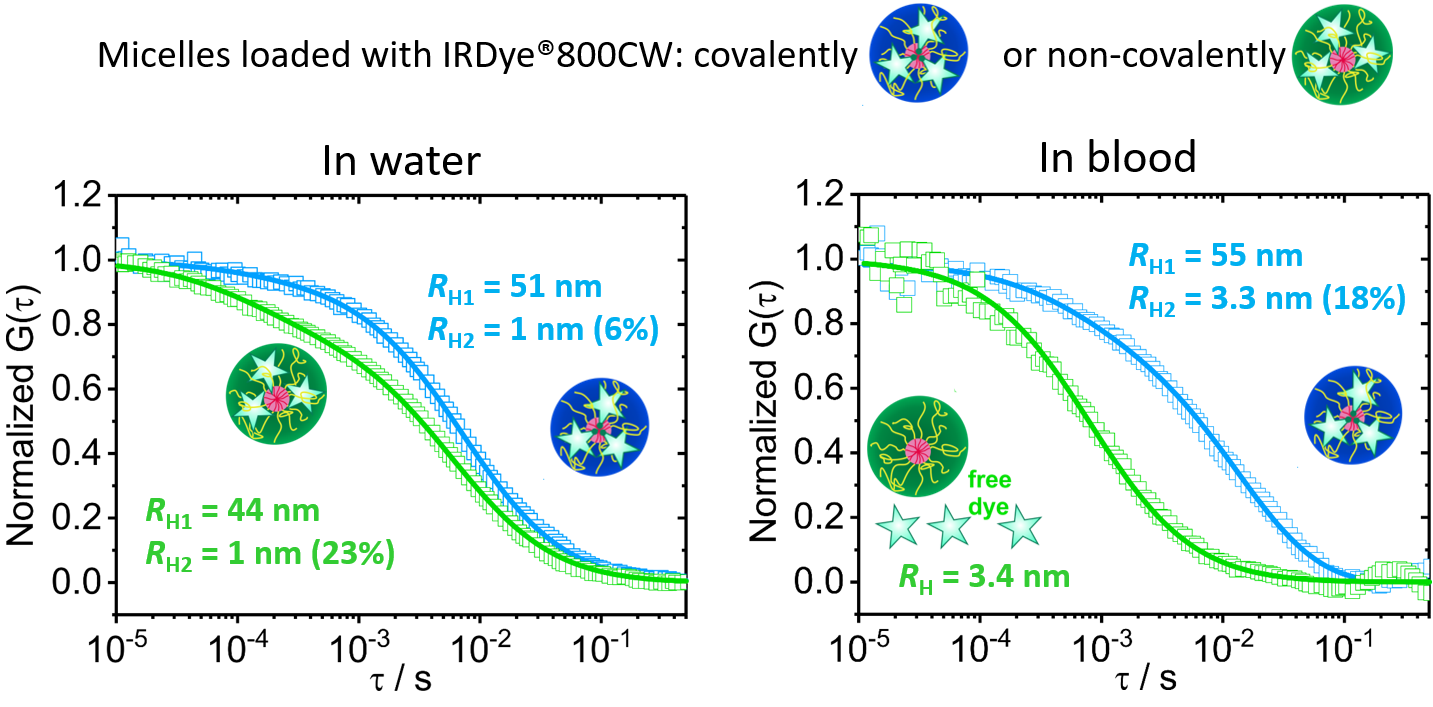
Figure 4. Loading stability of core-crosslinked micelle nanocarriers in blood. Normalized autocorrelation curves (symbols) and the corresponding fits (lines) are shown for core-crosslinked micelles that were either covalently (blue color) or non-covalently (green color) loaded with IRDye®800CW. In water (left) the dye is mainly loaded in the core-crosslinked micelles and only a small fraction of free dye was detected for both systems. In blood (right) the covalently loaded dye is still in the micelles even after 30 hours incubation, but the non-covalently (hydrophobically) loaded dye is fully released  after 30 minutes. In cooperation with M. Barz (Uni Mainz and MPIP, AK Weil).    


  • Schmitt S, Nuhn L, Barz M, Butt H-J, Koynov K:
    Shining Light on Polymeric Drug Nanocarriers with Fluorescence Correlation Spectroscopy.
    Macromolecular Rapid Communications, 2022, 43, 2100892 (doi 10.1002/marc.202100892)
  • Schmitt S, Huppertsberg A, Klefenz A, Kaps L, Mailaender V, Schuppan D, Butt H-J, Nuhn L, Koynov K:
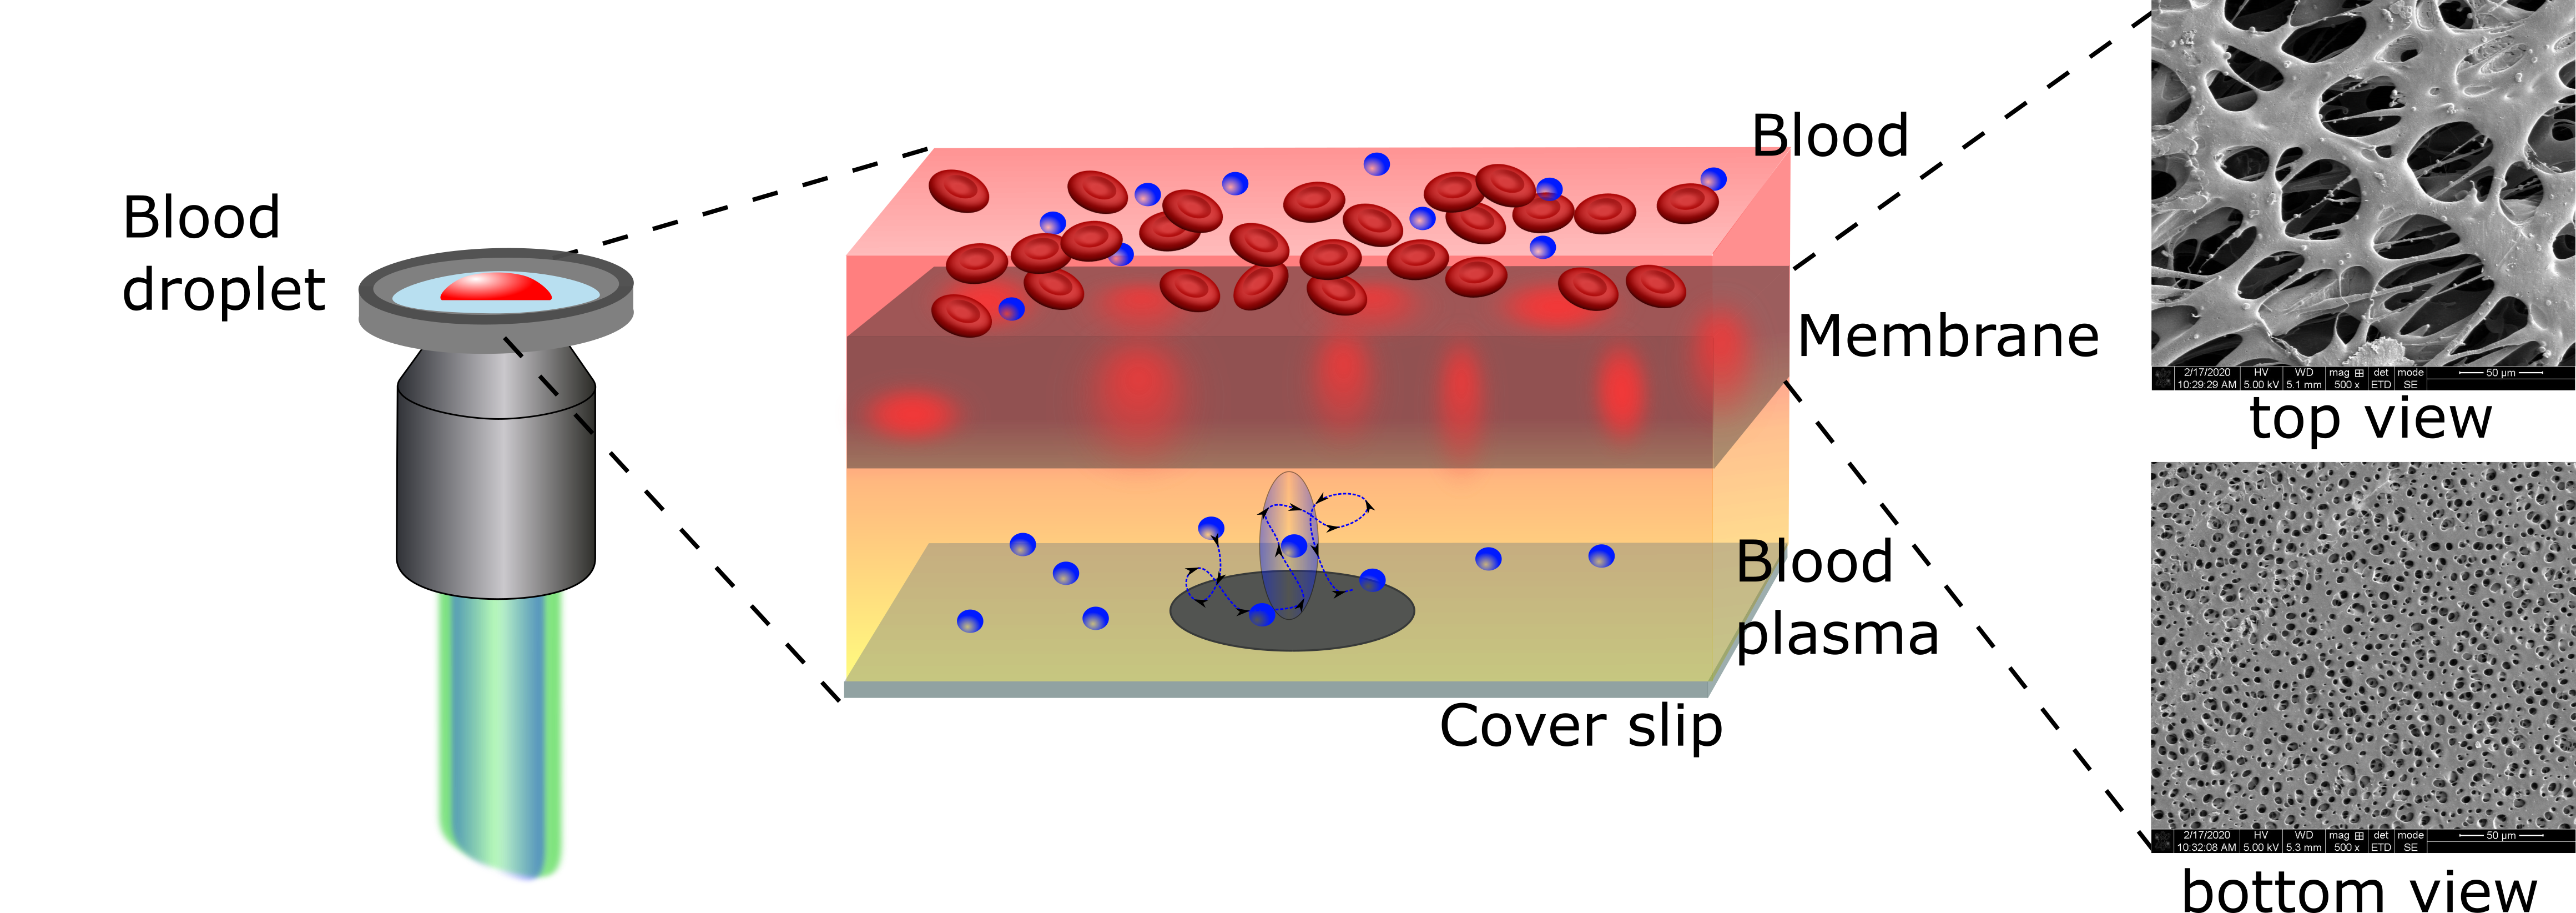
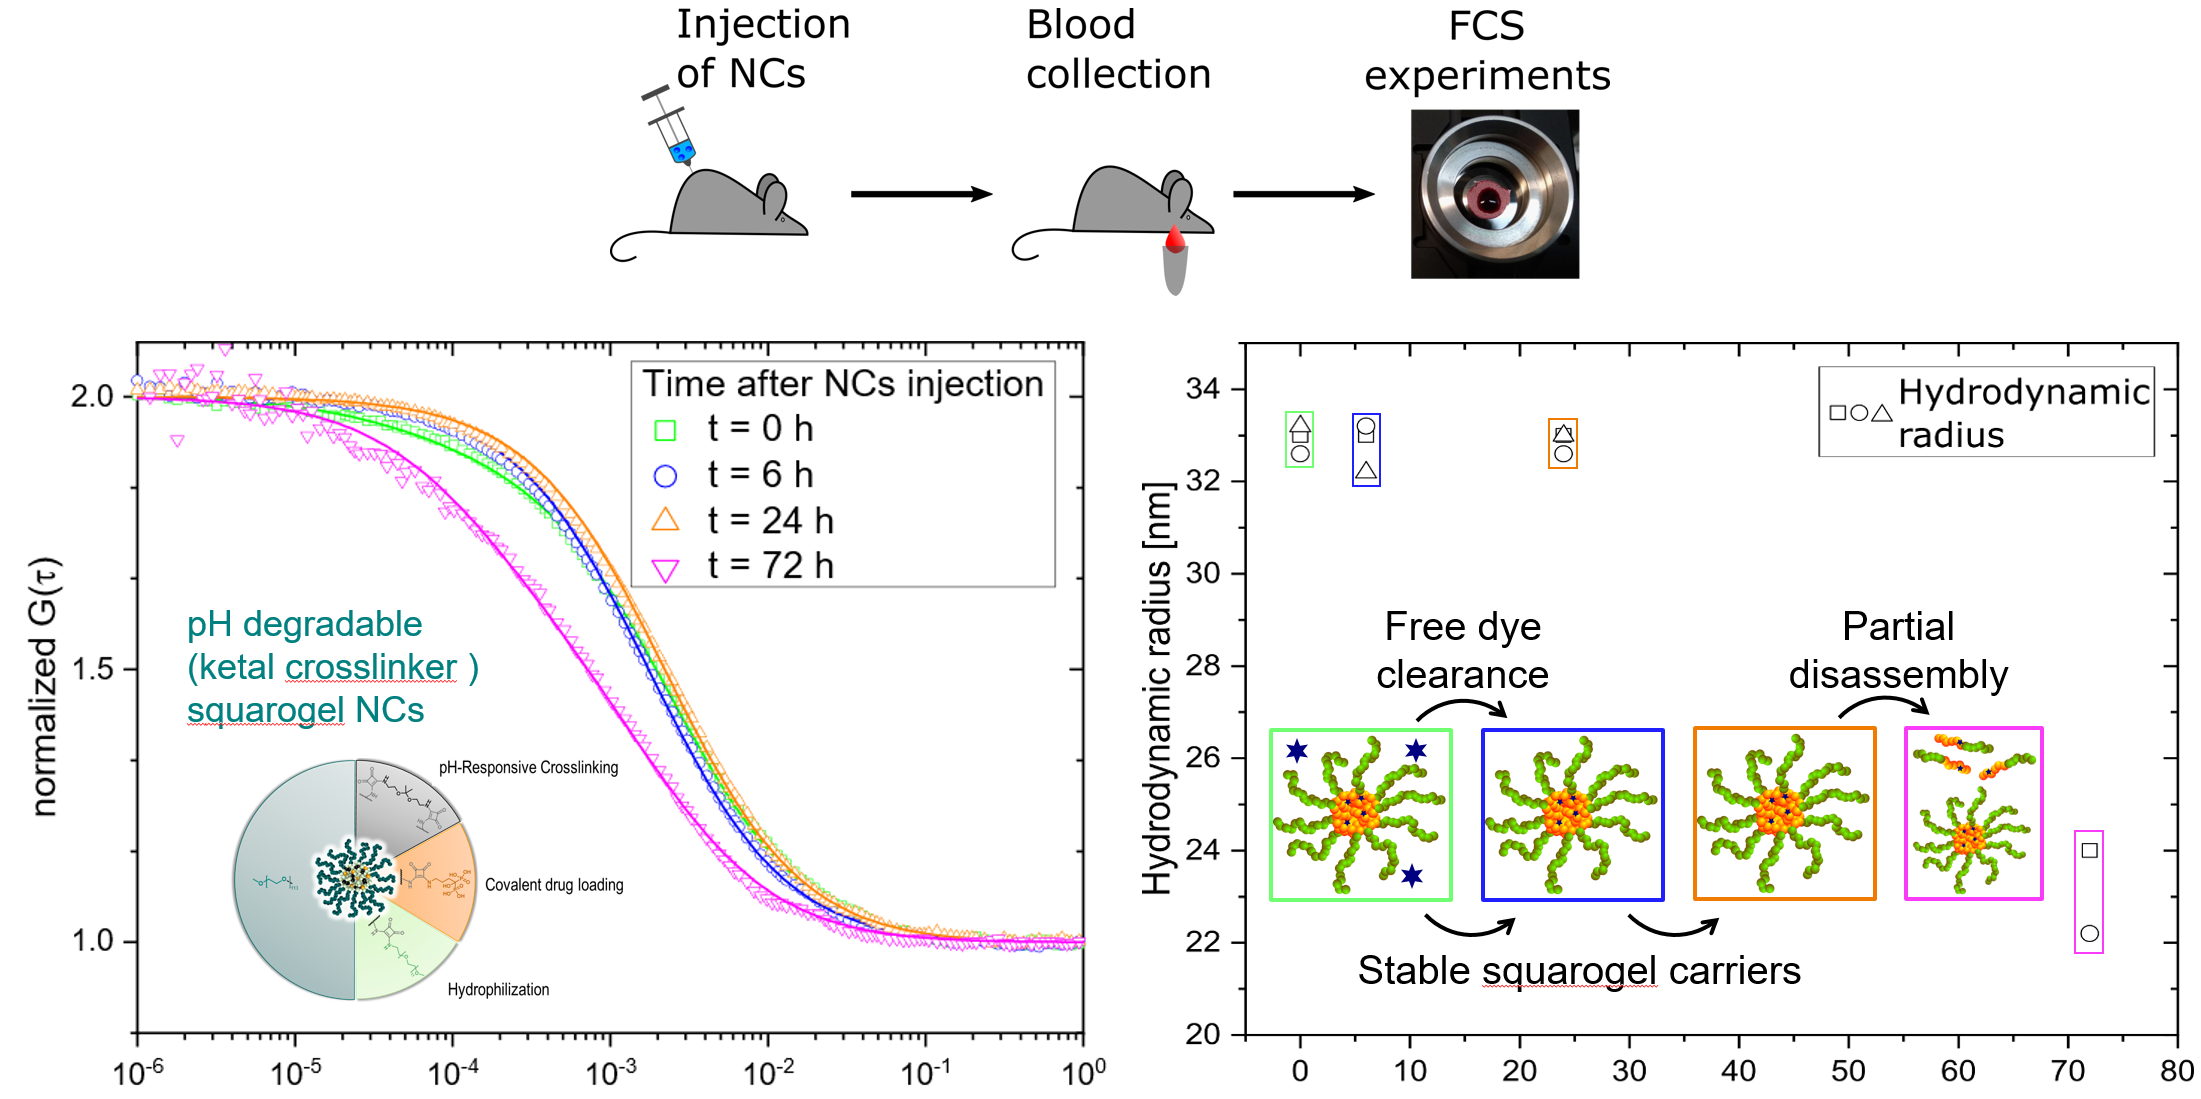
    Fluorescence Correlation Spectroscopy Monitors the Fate of Degradable Nanocarriers in the Blood Stream
    Biomacromolecules, 2022, 23, 1065-1074 (doi 10.1021/acs.biomac.1c01407
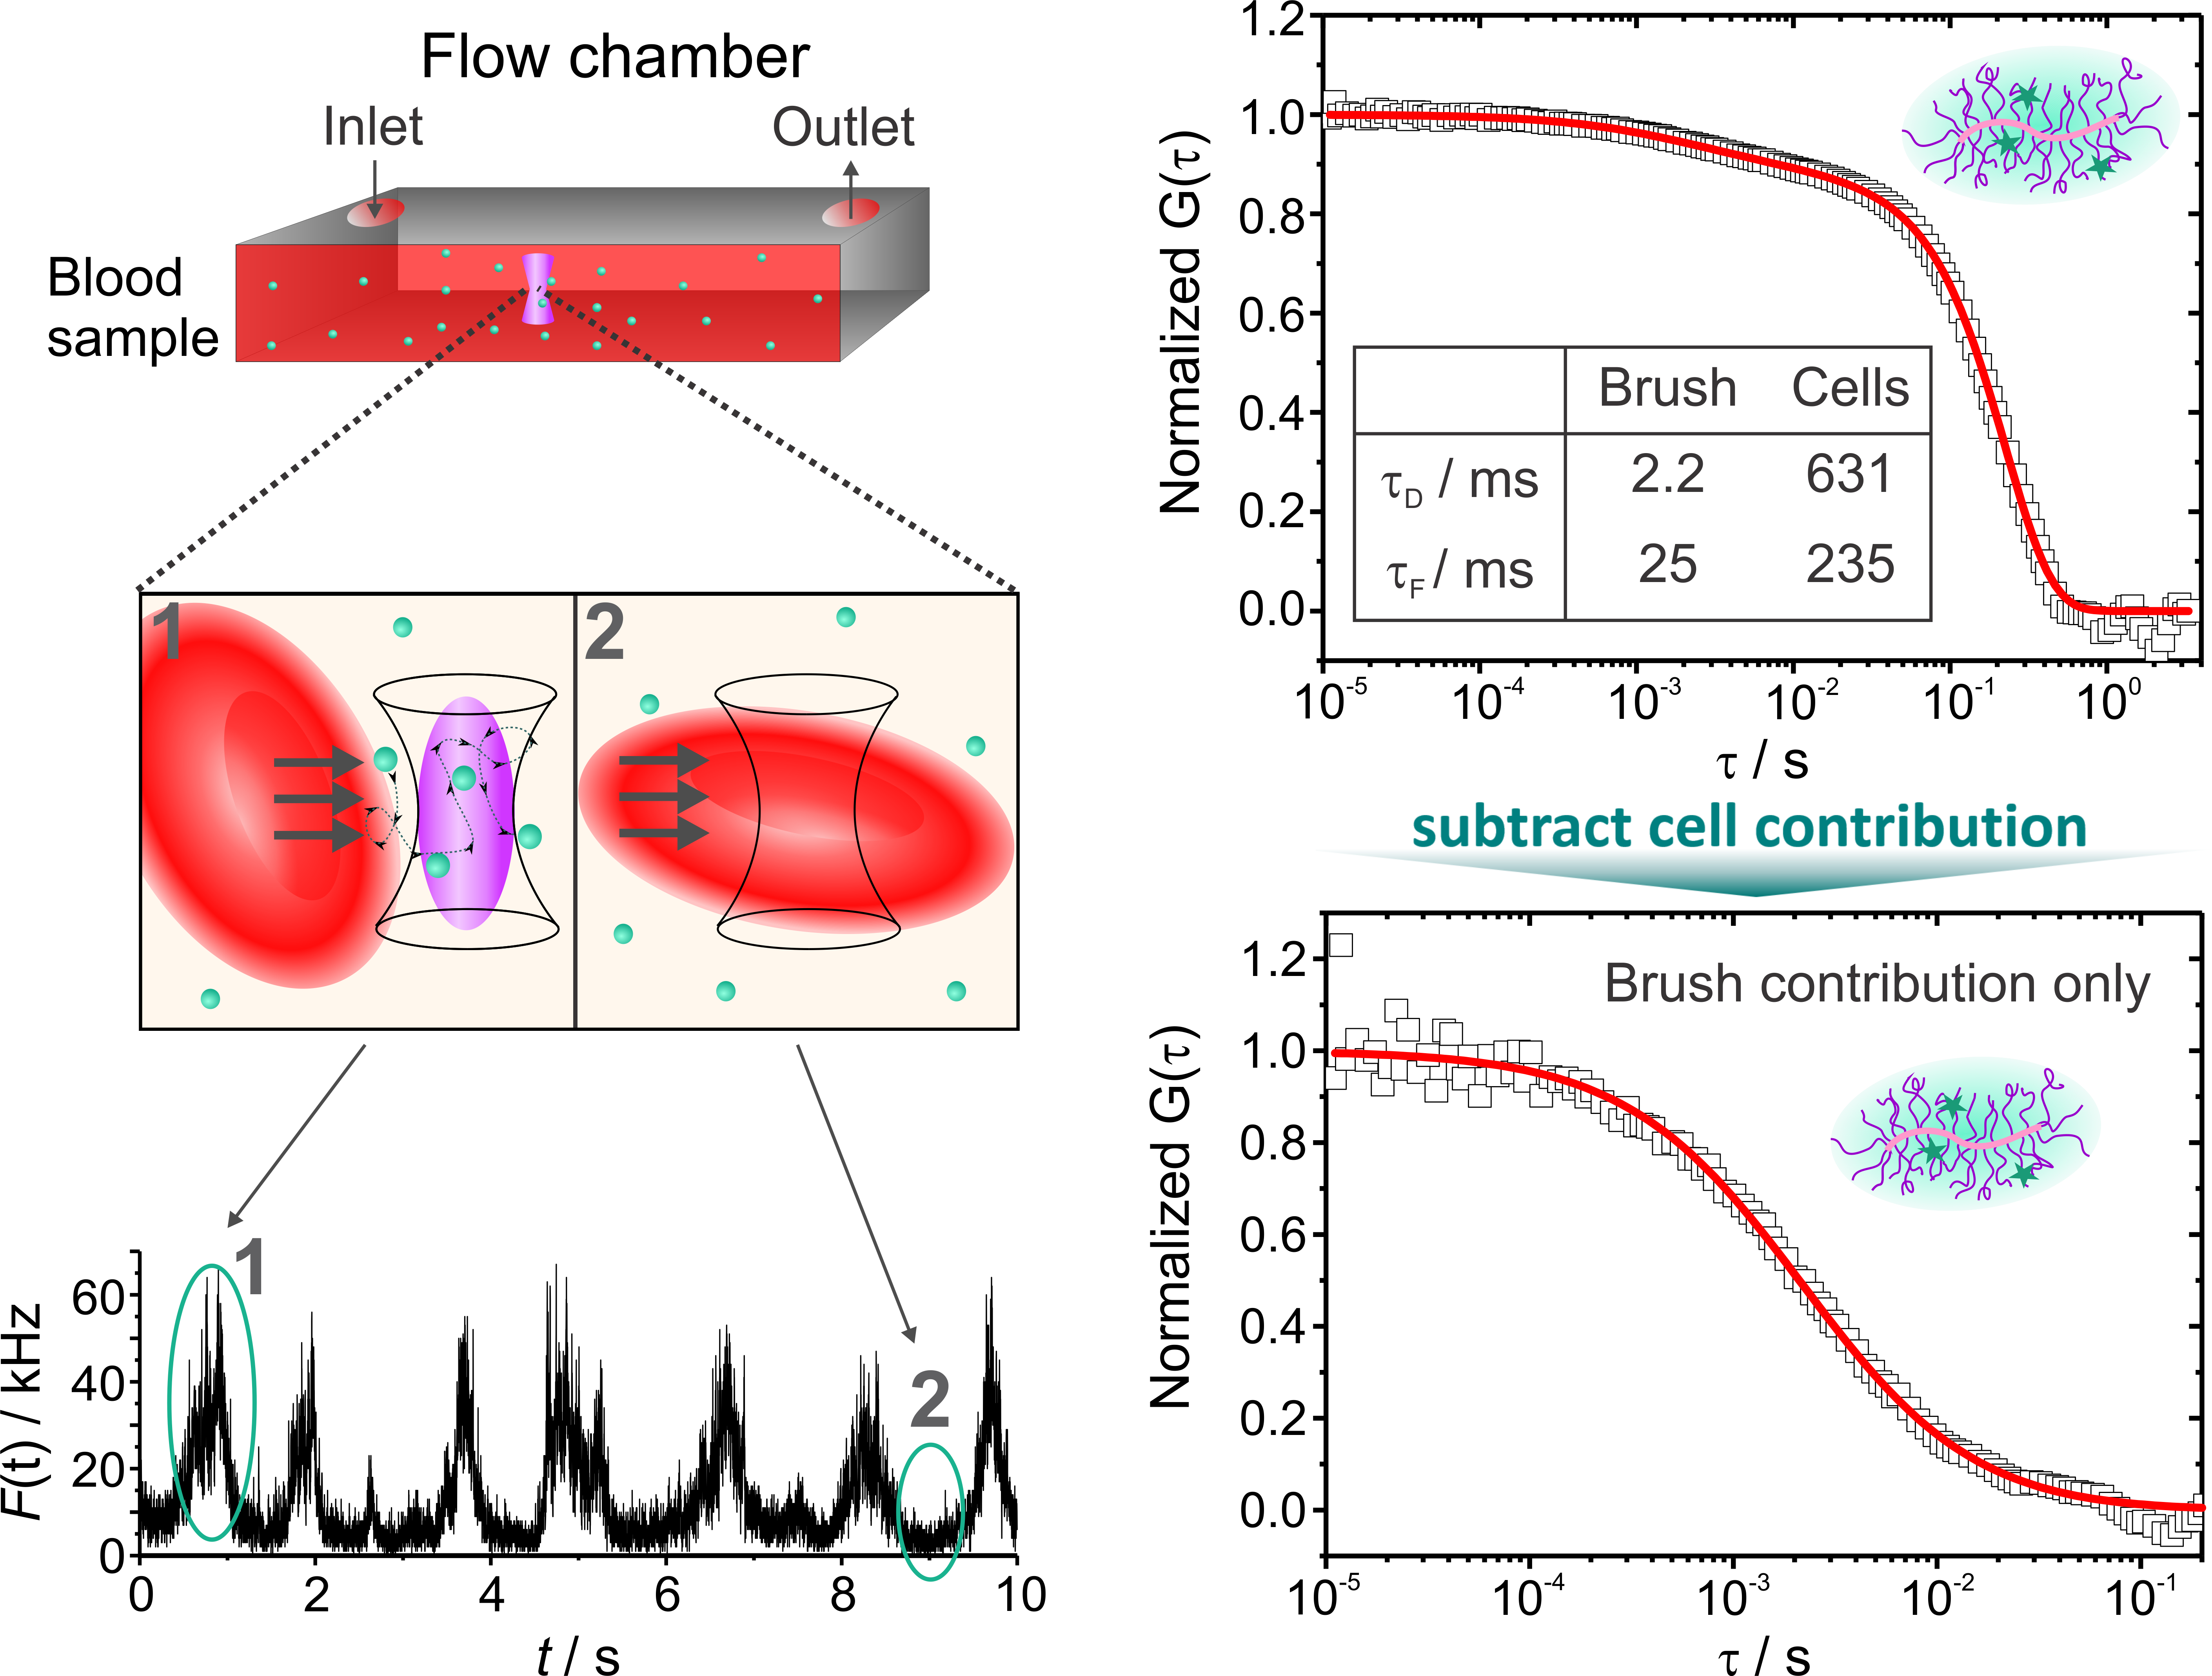
  • Negwer I, Best A, Schinnerer M, Schafer O, Capeloa L, Wagner M, Schmidt M, Mailander V, Helm M, Barz M, Butt HJ, Koynov K:
    Monitoring drug nanocarriers in human blood by near-infrared fluorescence correlation spectroscopy.
    Nature Communications, 2018, 9, 5306 (doi 10.1038/s41467-018-07755-0)

  • Czysch C, Medina-Montano C, Zhong Z, Fuchs A, Stickdorn J, Winterwerber P, Schmitt S, Deswarte K, Raabe M, Scherger M, Combes F, De Vrieze J, Kasmi S, Sandners N, Lienenklaus S, Koynov K, Raeder H-J, Lambrecht B, David S, Bros M, Schild H, Grabbe S, De Geest B, Nuhn L:
    Transient Lymph Node Immune Activation by Hydrolysable Polycarbonate Nanogels
    Advanced Functional Materials, 2022, 32, 2203490 (doi 10.1002/adfm.202203490)
  • Liu W, Alam N, Liu Y, Agafonov V, Qi H, Koynov K, Davydov V, Uzbekov R, Kaiser U, Lasser T, Jelezko F, Ermakova A, Weil T:
    Silicon-Vacancy Nanodiamonds as High Performance Near-Infrared Emitters for Live-Cell Dual-Color Imaging and Thermometry
    Nano Letters, 2022, 22, 2881-2888 (doi 10.1021/acs.nanolett.2c00040)
  • Doan-Nguyen TP, Jiang S, Koynov K, Landfester K, Crespy D:
    Ultrasmall Nanocapsules Obtained by Controlling Ostwald Ripening
    Angewandte Chemie-International Edition, 2021, 60, 18094-18102 (doi 10.1002/anie.202103444)
  • Bauer TA, Horvat NK, Marques O, Chocarro S, Mertens C, Colucci S, Schmitt S, Carrella LM, Morsbach S, Koynov K, Fenaroli F, Blumler P, Jung M, Sotillo R, Hentze MW, Muckenthaler MU, Barz M:
    Core Cross-Linked Polymeric Micelles for Specific Iron Delivery: Inducing Sterile Inflammation in Macrophages
    Advanced Healthcare Materials, 2021, 10, 2100385 (doi 10.1002/adhm.202100385)
  • Van Lysebetten D, Malfanti A, Deswarte K, Koynov K, Golba B, Ye TT, Zhong ZF, Kasmi S, Lamoot A, Chen Y, Van Herck S, Lambrecht BN, Sanders NN, Lienenklaus S, David SA, Vicent MJ, De Koker S, De Geest BG:
    Lipid-Polyglutamate Nanoparticle Vaccine Platform
    Acs Applied Materials & Interfaces, 2021, 13, 6011-6022 (doi 10.1021/acsami.0c20607)
  • Lueckerath T, Koynov K, Loescher S, Whitfield C, Nuhn L, Walther A, Barner-Kowollik C, Ng D, Weil Tanja :
    DNA-Polymer Nanostructures by RAFT Polymerization and Polymerization-Induced Self-Assembly
    Angewandte Chemie - International Edition, 2020, 59, 15474-15479 (doi 10.1002/anie.201916177)

  • Chen C, Wunderlich K, Mukherji D, Koynov K, Heck A, Raabe M, Barz M, Fytas G, Kremer K, Ng DYW, Weil T:
    Precision Anisotropic Brush Polymers by Sequence Controlled Chemistry.
    J. Am. Chem. Soc. 2020, 142, 1332-1340 (doi 10.1021/jacs.9b10491)